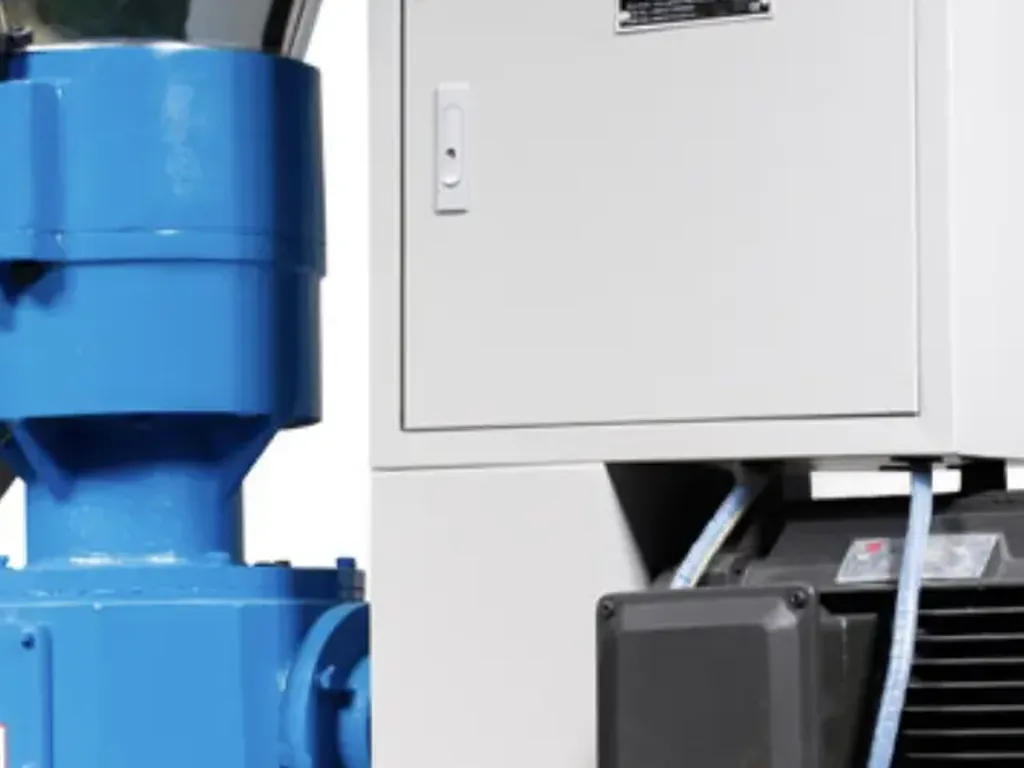
Drive failures are usually gradual, not sudden. Gradual means there are signs, and signs can be measured. You do not need an expensive online monitoring system — an infrared thermometer and a simple vibration pen catch most of them.
Four locations: the motor drive-end and non-drive-end bearing housings, and the gearbox input-shaft and output-shaft bearing housings. At each location measure vibration horizontally and vertically, then surface temperature.
Mark the measuring points (a centre-punch dot or a reflective sticker) and measure at the same point every time, or the data cannot be compared. Many people neglect this, and then cannot tell whether a swing in the numbers is the machine changing or the measuring point changing.
Keep the records as a table: date, speed, load state, vibration, temperature. Only like-for-like comparison means anything — never mix unloaded and full-load readings.
 FIELD · SCHH-2026
Look at the trend before the absolute value. A machine steady at 3 mm/s month after month is far healthier than one sitting at 2 mm/s but climbing 0.5 mm/s every month.
Reference thresholds (rigidly mounted, general gearboxes around 1500 r/min): RMS vibration velocity below 4.5 mm/s is good; 4.5–7.1 mm/s calls for attention and shorter check intervals; above 7.1 mm/s, schedule a shutdown inspection.
For temperature, differences are more useful than absolutes: the two bearing housings of one machine should not differ by more than 10 °C — a larger gap means poor lubrication or misalignment on one side. A housing surface above 80 °C needs immediate investigation.
A sudden jump in vibration with abnormal noise usually means a bearing rolling element or a gear flank is in trouble. That is when you bring in spectrum analysis: bearing characteristic frequencies point to bearing faults, gear mesh frequency and its harmonics point to tooth-flank problems, and harmonics of running speed point to misalignment or looseness.
 FIELD · SCHH-2026
Check the gearbox oil level weekly and the oil colour monthly. Milky oil means water ingress; black oil with metal flecks means internal wear. An oil sample analysis costs less than an oil change.
Re-check coupling alignment every six months, especially where the feet vibrate or the foundation may be settling. Misalignment has a classic signature: axial vibration exceeds radial, and vibration climbs with load.
Check foundation bolts quarterly. Loose feet distort the whole vibration picture and speed up bearing damage. Tap them lightly with a hammer and listen, or spot-check with a torque wrench.
| Maintenance item | Interval | Method | Acceptance criteria |
|---|---|---|---|
| Vibration and temperature log | Monthly | Four locations, two directions, same point, same load | Vibration <4.5 mm/s; temperature difference between the two bearing housings <10 °C |
| Gearbox oil level and colour | Weekly / monthly | Visual via the sight glass | Level within the marks; no emulsification, no metal flecks |
| Oil sample analysis | Every 6 months (quarterly under heavy load) | Water, viscosity, metal particles | Within in-service oil limits |
| Coupling alignment re-check | Semi-annual | Dial indicator or laser alignment tool | Radial / angular offset within tolerance |
| Foundation bolt tightness check | Quarterly | Torque wrench spot checks | No looseness |
| Spectrum analysis | When vibration exceeds thresholds | Portable vibration analyser | Locates the faulty component |
The entire value of vibration and temperature monitoring lies in one word: trend. A single reading means little; only continuous data from the same point, by the same method, on a fixed cycle reveals degradation. So the first task in monitoring is not buying instruments but setting a standard - marking measuring-point locations (stamped or labeled), fixing the measurement direction (horizontal, vertical, axial), fixing instrument and settings (same unit, same configuration), and fixing the cycle (weekly or monthly by equipment class). Once the standard exists, data taken by different people is comparable, and only then does a trend exist.
Design the data sheet so problems become visible: one row per date, columns for the overall vibration and temperature at each measuring point, and a remarks column on the right for anomalies and actions. Three months of rows laid out and you can see at a glance which machine is climbing. A step further is to connect the data points into curves and post them on the board - crews glance at it in passing every day, degradation becomes public information, and action stops being postponed.
Thresholds are managed on two levels: an alarm threshold (above it, investigate the cause and schedule a re-check) and a trip threshold (above it, stop the machine and act immediately). Set initial thresholds from factory standards or common industry values (such as the zone boundaries for vibration velocity RMS), then calibrate them against your own baseline after three months of running - alarm at 50% above baseline and trip at double is a widely used rule of thumb. Thresholds are not better for being tighter: too tight produces constant false alarms and numbs the crew, too loose makes them meaningless. Calibration is a continuing activity.
Consider it when two of three conditions hold: downtime losses are large (line-stopping critical equipment), manual patrols cannot cover it (positions too high, too hot or unreachable, or simply too many points), or degradation is fast (the window from anomaly to failure is shorter than the patrol cycle). For most plants' Class B and C equipment, monthly portable testing plus weekly simple screening is enough. Do not ignore the hidden costs of an online system: sensor installation and maintenance, and the system itself needing someone to watch it - an online system nobody looks at is more wasteful than having none.
 FIELD · SCHH-2026
It depends. Above the alarm threshold but below the trip threshold, with no accompanying symptoms (noise, temperature rise, abnormal current), re-check within 48 hours to rule out measurement error and transient operating conditions. Above the trip threshold, or with obvious noise, sharp temperature rise or current fluctuation, stop and inspect immediately - do not gamble. The governing principle is dual confirmation by "data plus symptoms": a lone abnormal reading may be a mis-measurement, but data and symptoms abnormal together is a real alarm. Better to stop once unnecessarily than to miss one stop - this discipline belongs in the operating procedure.
Overall vibration tells you "there is a problem"; the spectrum tells you "what problem". Reading a spectrum at beginner level only requires recognizing four kinds of characteristic frequency: running frequency (once per shaft revolution - the main signature of unbalance), blade-pass frequency (running frequency times blade count - flow-field issues in fan-type equipment), bearing characteristic frequencies (four of them: outer race, inner race, rolling element and cage - calculable from bearing model and speed, with fixed values), and gear mesh frequency (tooth count times running frequency - the marker of gearbox problems). Measurement software usually marks these automatically; all you have to do is see which characteristic peak stands out on the plot.
The basic logic of interpretation: unbalance shows as a prominent running frequency that varies with the square of speed; misalignment shows as a prominent 2x component with increased axial vibration; outer-race bearing damage shows as a prominent outer-race characteristic frequency (often with sidebands); looseness shows as multiple harmonics and fractional harmonics; cavitation shows as broadband random vibration. There is no need to memorize these correspondences - look them up each time you meet one, and after a few times they become intuition.
One piece of practical advice for the beginner stage: do not try to interpret every spectrum yourself. Get the spectrum data-collection standard right (fixed measuring points, consistent parameters, regular cycles) and hand the data to a professional when something is abnormal - that costs far less than training a vibration analyst. Data discipline is the part you must get right, because with non-standard data even the most professional analysis cannot produce a reliable conclusion.
 FIELD · SCHH-2026
This article was written in-house by the Industrial Equipment Services Division. The thresholds, intervals and scrap criteria are field-experience values; in practice follow the equipment manufacturer's technical documents, current national standards and special-equipment safety regulations. Inspection and testing of special equipment (cranes, pressure vessels, etc.) must be carried out by a qualified body.
Send us your equipment list and operating conditions, and we will give you a workable inspection and maintenance standard.
 Scan to add Engineer Man on WeChat
 Guangzhou Yujihang Computer Technology Co., Ltd. · www.accpc.com.cn
 Guangzhou Henghuan Technology Co., Ltd. · www.hhrobotics.cn
 Nanchong Henghuan Robotics Co., Ltd. · www.hhrobots.cn